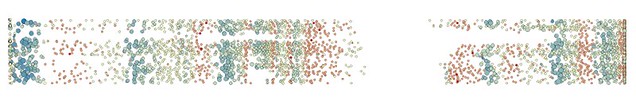
First of all, a couple of "driver DNA" charts (generated using Gephi) showing gLong ("longitudinal g-force") against the throttle pedal force (rThrottlePedal, first chart) and the brake force (pBrakeF, second chart). In each case, the x axis is distance round the lap (sLap). The gLong force is coloured towards blue for < 0, yellow for 0, towards red for above 0 and the node size is proportional to throttle or brake reading as appropriate.
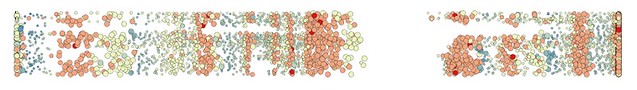
In the case of the throttle (above), we see that when the throttle is full on, Hamilton experiences a positive lateral force.
In the case of the brake, below, we see a significant negative lateral gForce when the brake is applied (the driver is pushed forwards).
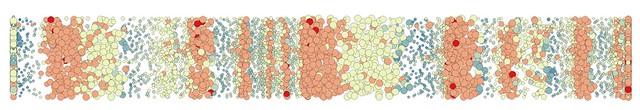
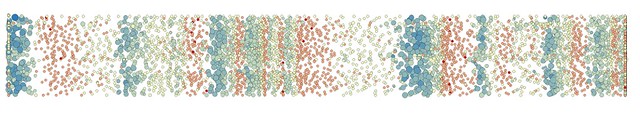
UPDATE: I oops'ed in generating the data file I used to create the above driver DNA charts - I was suppressing data where there was no GPS co-ordinates available. Here are the charts with the missing data included...
First, the throttle:
And the brake:
We can look at this more closely by plotting the lateral and longitudinal forces against the brake and throttle levels.
One of the most noticeable affects is when Hamilton brakes - this is when we get the negative longitudinal "g-force":

Also note that Hamilton doesn't tend to brake hard when actually going round a corner (i.e. when experiencing a lateral "g-force") [plot(gLong~sLap,data=HAMfull_mco_2011,main="F1 2011 Monaco - HAM Telemetry")]:

How about the throttle? One thing that jumps out here is that the throttle isn't applied so much under heavy retardation (as we might expect!) [plot(gLat~pBrakeF,data=HAMfull_mco_2011,main="F1 2011 Monaco - HAM Telemetry")]

Cornering doesn't prevent Hamilton using the throttle though (although we also see there are plenty of occasions when Hamilton lifts off the throttle too...) [plot(gLat~rThrottlePedal,data=HAMfull_mco_2011,main="F1 2011 Monaco - HAM Telemetry")]:

Here's a plot of gLat vs gLong: might different circuits give a different signature? [plot(gLat~gLong,data=HAMfull_mco_2011,main="F1 2011 Monaco - HAM Telemetry")]

And finally, brake versus throttle [plot(pBrakeF~rThrottlePedal,data=HAMfull_mco_2011,main="F1 2011 Monaco - HAM Telemetry")]:

Note how much time is spent on the throttle with no brake, or brake with no throttle, although there are times when throttle and brake are applied. Again, I wonder if different circuits might have slightly different signatures?
So: what do you learn from those charts?
Data is grabbed from the McLaren F1 Live Dashboard during the race and is Copyright (©) McLaren Marketing Ltd 2011 (I think? Or possibly Vodafone McLaren Mercedes F1 2011(?)). Last year, I think that speed, throttle and brake data were sponsored by Vodafone; I'm not sure how it stands this year.
As ever, thanks to @bencc for grabbing the data.
Interesting stuff as always Tony.
ReplyDeleteI don't know how aware you are of racing theory about braking and cornering etc but the traditional way a racing diver is taught to corner is very different to how "we" normally drive - the theory being that you want to exit the corner accelerating, you want to be on the limit of sideways grip thru a corner, and you don't want to upset this last item by transferring the balance from the front to the rear wheels mid-corner, so you're taught to brake in a straight line to BELOW the speed required, then as you first turn into the corner, you apply the throttle gently (ie at the beginning of the corner), and then apply more throttle as you progress thru the corner, to keep the weight balance consistent (the so-called "Slow In, Fast Out" technique).
Now the hallmark of many great drivers (Alain Prost perhaps most famously) is their noted ability to buck this practice, to continue to brake during the turn in to the corner (thus entering faster and not slowing as much etc) and change from brake to throttle mid corner but then to cope with the resultant weight transfer from front to rear tyres without having to slow too much, and then still exit the corner at the same speed as people who slowed more (this tends to necessitate taking a different line thru corners too of course).
So if you compare different drivers by combination of G-forces in each direction and throttle/brake position, this may be able to illustrate the degree to which different drivers do this (see also "Buttons smooth style" etc).
There is also the issue of "blown diffusers" whereby the engine mapping is modified so that if you apply the throttle while braking, the ignition has been retarded so you don't get ignition in the cylinder (ie power to the rear wheels) but instead the unburnt fuel exits the cylinder into the exhaust and ignites there, producing a hot and energetic exhaust flow which generates extra downforce when you need it. IN this case you might see someone applying the throttle without necessarily accelerating. (My understanding of this aspect taken very much from the excellent technical F1 analysis at http://scarbsf1.wordpress.com/ - disclaimers about mistakes in assumptions being my fault etc).
There are changes in the regulations afoot to reduce this latter practice (it's thought to be a key reason why the Red Bulls qualify so well - they use this technique during qualifying when they can afford the extra fuel consumption, but to do so for an entire race would saddle them with a significant weight penalty for carrying sufficient fuel).
But I'm not sure how small these details are - I think you might have to work on the visualisations to illustrate such techniques.
Hi Tim - thanks for the comment... I'm not really aware of anything to do with racing theory, which is one reason I started looking at the f1data - to see what sorts of stories it hides (and help others point out to me the "bleedin' obvious to proper race fans";-) so your comment is much appreciated:-)
ReplyDelete(Just by the by, did you see the PratPErch post on "Tyre side slip explained" [ http://www.pratperch.com/2011/05/tyre-side-slip-explained/ ]. One thing I want to try to do on this blog is pull in technical discussions that can be related back to the data; if you ever come across links that might fit into this approach, please add them as a comment to the nearest relevant post.. or maybe pop up a blog post around the topic?!;-)
I'm not sure what resolution data the teams have access to? The McLaren live telemetry feed streams samples at about 1Hz, but I'm not sure how much information is lost that higher resolution data (if it's available) might reveal?
One thing I intend to do in a follow on post is blot the brake/throttle/gLat/gLong against sLap (distance round the lap) to give a view of the data more from the lap's point of view. (I was hoping to do a circuit map too, but the GPS data is all over the place... This shouldn't be so much of a problem for other circuits (except maybe for other street circuits.) I'll also try to start picking up on a view of the data that is maybe more traditional (as I experimented with last year: http://blog.ouseful.info/2010/03/21/f1-data-junkie-looking-at-whats-there/ )
Once again - thanks for the comment... I'll get my head round the intricacies of this sport one day!
PS on the topic of the blown diffuser, my reading of the ScarbsF1 post [ http://scarbsf1.wordpress.com/category/exhaust-driven-diffuser/ ] was a little different? "The throttle pedal is instead the drivers method to request power\torque, the cars SECU then controls the level of throttle required to meet the drivers request. So as the driver lifts off the throttle pedal, he is no longer requesting power\torque and therefore the throttles should close. what happens with these EBD mappings is that the throttles remain open.." That is, the ECU handles the throttle when the driver lifts to power the blown diffuser? So it's not under the driver's control? And if the telemetry is showing the 'driver throttle request', we shouldn't be able to see any blown diffuser effect on that measure? (I'm happy to be proven wrong on this. I have absolutely no idea what I'm talking about;-)
Cool - hoped I wasn't teaching you to suck eggs.
ReplyDeleteDid a quick search for an explanation of slow-in-fast-out and came across part 17 of this
http://phors.locost7.info/contents.htm
which is maybe too much detail, but see also short articles such as
http://www.nasaproracing.com/hpde/inslow.html
http://www.nasaproracing.com/hpde/weighttransfer.html
The tyre-slip write-up is appreciated (see also parts 19 onwards of the above) - it's worth noting that the tyre grip is of course maximised in any one direction when there is no force in the perpendicular direction, so of course you get maximum grip for braking when you brake in a straight line, and notionally the maximum cornering grip when not changing speed, but these are both modified by weight transfer and aerodynamic effects (plus road camber etc). And that the key of cornering technique is to exit as quick as possible so that you carry that extra speed all the way down the following straight (rather than maximise speed at some notional apex).
re: blown diffuser, yeah, I was probably simplifying one concept in my incomplete recollection of scarbsf1's correct explanations. But are you sure telemetry shows the driver's request rather than the actual throttle map ? Martin Brundle (I think) made a comment on the weekend about how short the pedal movement is on the throttle pedal, I think he said less than an inch ("basically on/off"), and the current engine mapping determines the actual throttle setting. They got rid of full traction control, but I was under the impression the driver changes the engine mapping almost on a corner-by-corner basis to appropriate levels as previously determined during practice... again this may be
And even so, it still explains another reason why it makes sense to enter the corner slower and have your foot on the accelerator through the entire corner.
We should take this conversatio down the pub sometime :)
I can lend you my copy of
http://www.amazon.com/Ayrton-Sennas-Principles-Race-Driving/dp/1874557403
too if you want.
@Tim Your comments are totally appreciated - the blog is set up in part as an experiment into informal learning and teaching, in part to record my own learning journey through the weird and wonderful world of motorsport on the one hand, and data viz on the other, so the links and explanations are perfect, though my homework will have to wait till the weekend;-)
ReplyDeleteAs far as what the telemetry says.. hmm I have no idea; I'll maybe try to chase that down (anyone got any leads into McLaren F1 so we can ask?!;-)
As to the pub - yes, definitely would be a good call sometime... and re: the Senna book: looks fascinating (duly added to my wishlist)
Sadly enough, I can't get these graphs out of my head :-) Then I had a thought - it would be great if you could document the process by saving the R session files and making them available here so people can see exactly how to produce these great graphs. Possible?
ReplyDelete@ajcann I've been posting snippets (will add a couple to this post now) and I'm working on a strategy for how I can do it more directly (this blog is an experiment in a wide variety of things...;-)
ReplyDeleteThe first phase is just trying to find a range of visualisations/core charts that seem to make some sort of sense; the next step on the R/gnuplot front will be to get the code tidied and sorted (and lodged in the f1datajunkie github repository [ https://github.com/psychemedia/f1DataJunkie ]; I also need to tidy and fix data representation/column headings/order on the spreadsheets (this in turn will terminate with a Google visualisation API/spreadsheet as database query form, that will generate URLs that should link to CSV exports that can be pulled into R directly. [Note to self: is there an R/Google spreadsheets module anyway?]
The step after that will be the automated generation of posts with embedded documentation (maybe I should have started on that first, but I was rushing...), probably using dexy [ http://dexy.it ] (though I've not done more than install that yet!:-( This will then give the option of documenting and displaying each chart in the same post.
I do wonder if this would clutter posts too much though as an F1 blog? The alternative is to to put the code in the Visualisation Types page? OR maybe start a new code page for code snippets?
But a mere mortal such as I is never going to hang out on GitHub. The R session files are just simple text files which show the process of plotting the graphs step by step, which even I should be able to figure out (unless there are too many dependencies?).
ReplyDelete@ajcann how do I save R session files?!;-) (They'd need pruning too - lots of clutter in there!)
ReplyDeleteBriefly looked at beta.kasabi.com as a service to let people host datasets and then publish APIs onto them - might be sort of interesting for a project like this :)
ReplyDelete@tim I know some of the Talis folks, and was at a Kasabi preview day earliier this year. Not sure what the best way of modeling the data would be? (Is there an RDF schema for motorsport timing or telemetry data? In fact, is anyone storing sports data of any sort in triple stores?)
ReplyDeleteThis comment has been removed by a blog administrator.
ReplyDelete