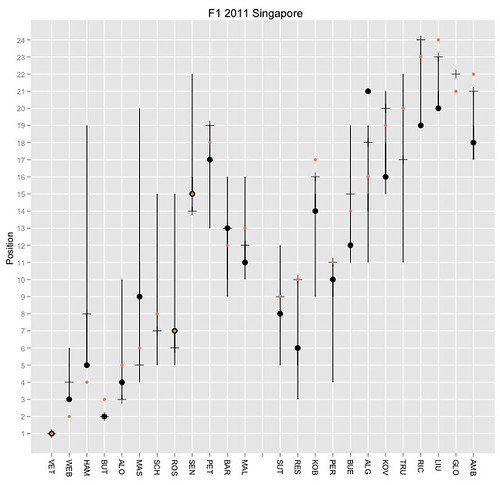
(Red dot: grid position; black dot - final position; plus/horizontal tick mark - position at end of lap 1; vertical line - range of positions held during race.)
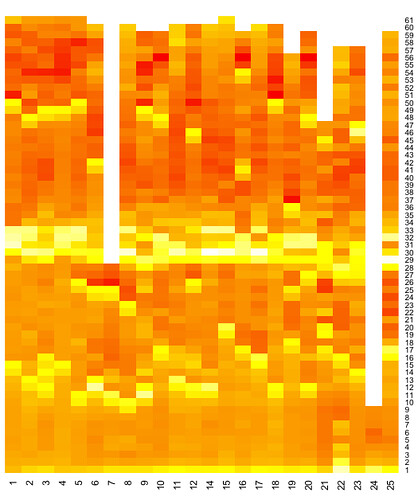
And here's the laptime heat map:

(Hot red colours are faster laps, yellow laps are slower ones, and indicate PIT activity or the presence of a safety car.)
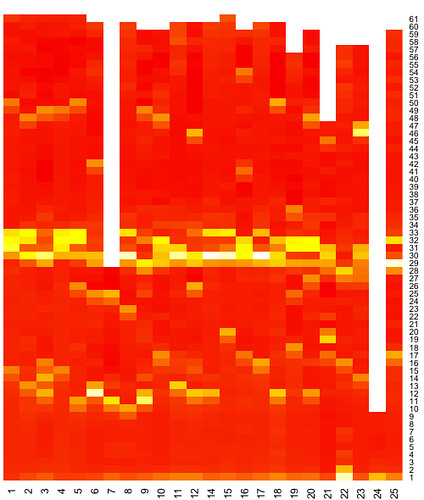
If we colour the map according to the difference in laptime for each car given it's current and previous lap time, we see the pit and safety car activity more clearly:

(Note to self: work out how to do colour palette mapping in a non-linear way. Also pick out fastest laps and purple laps.)
Hi Tony,
ReplyDeleteI've been having a play with the data too - looking at getting useful stuff out of the race laptimes www.intelligentf1.wordpress.com if you want to have a look.
I reckon that you need to eliminate safety car laps and pitstop laps to give a better resolution of the scale on the laptime heat map, and then you might be able to resolve some kind of 'stint speed'. That would be useful.
Cheers,
James.
Hi James - Blimey: www.intelligentf1.wordpress.com is impressive! Are you going to publish any details on the actual development of your model, and how you go about tuning it?
ReplyDeleteRe: the heatmap - I'm trying to work out R tricks as I go, so on my to do list is work out how to scale colours according to some sort of thresholded model, as well as illustrating purple laps and and pitstops. Got a lot of other commitments this weekend though which completely trashes my play time:-(
Re trying to identify stint speeds - I'll have a ponder on that, including as you suggest ways of masking the outlier/noise laps. I guess one thing that might be useful would be to develop - and maybe argue over - a set of heuristics about constructing automatic filters over lap times to try and identify times that can be used for modeling?
Something else on my half done list is a set of routines for looking at pitstop data to try and contribute clues to model around the relative performance around pit stops...I was hoping to do that this weekend, but it's looking unlikely now:-(
PS I don't suppose you'd consider switching your RSS feed to a full fat feed would you? I tend to live in my feed reader...
PPS what environment are you building your model in? And where are you getting the data? From the timing app? If so, I don't suppose you're logging it all are you...?;-)
Thanks for the positive response. I think as I get more races under my belt, I should get more ideas. One thing I have noticed trying to get parameters from previous years races is that the tyres dominate the curves. I would have a completely different set of numbers for the Bridgestones. Not done a wet race yet either.
ReplyDeleteI think that if you look at the race history charts, the pace is really quite constant in a stint - linking the stint speed to the fuel load/tyre age is most of the game. Once you do that, then you can start playing.
I'm thinking about feeds or twitter or something but having a job and a family delays stuff a bit. I'm concentrating on seeing what I can glean from the model for now.
As lots of odd things happen in races, I'm very wary of automating - I fit the curves by hand. At the moment it's Excel based, but I will write myself an interactive chart in which I can then hone the curve fits. Might even be able to make it available for playing with online if people are interested and if I can make it easy enough to use.
At the moment the data is from the F1 media centre post session, but there are plans afoot to get it from the timing app - and play in real time. Not everything you might want comes from the timing, though...
Happy to discuss ideas as we go.
Hi James
ReplyDeleteRe getting the data from the FIA - how are you pulling it from the PDFs? I have a scraper at https://scraperwiki.com/scrapers/f1_timing/ that pulls the data into separate CSV files/sqllite database tables (they get emptied a week or so after each race) and I also push the data into a Google spreadsheet (via the Data page on this blog). If i'm around on a race weekend, I can usually get the data scraped and republished within 5-20 mins or so of it appearing on the FIA site (assuming the scrapes work cleanly and don't need repairing!)
I'm also trying to automate the production of statistical graphs based around the data. Let me know if you're interested in a chat around what charts might be useful and how I might tune them;-)
The route I'm taking there is to pull the data into R from a Google spreadsheet, the idea being that the scripts should be shareable and maybe a small community can start tinkering with them...
tony