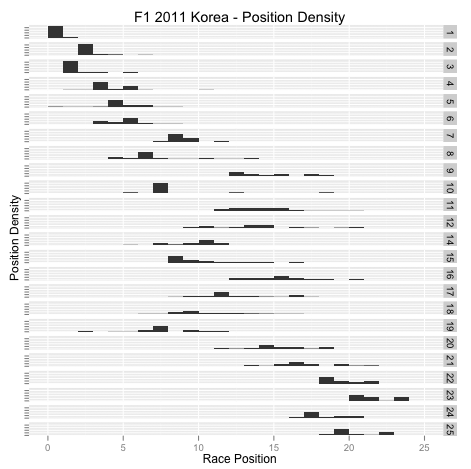
The idea behind this chart is that we plot how much time each car spent in each race position, the idea being that if the car did not spend the whole race in the same position, then the driver had an interesting race...
Of course, it might be the case that the driver was caught in a battle for the whole race without making (or losing) places, so to complement the above, here's a chart that shows how much time was spent within a certain time distance of the car in the race position in front, and the car in the race position behind, taken over the whole of the race.
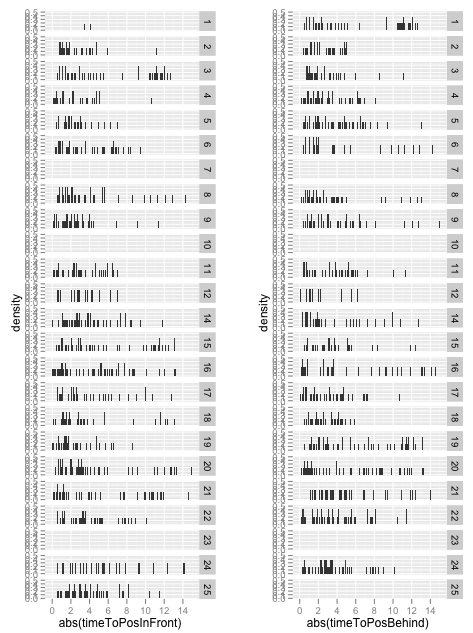
So for example, car 2 spent quite a lot of time attacking, car 3 spent a fair amount of time defending, car 1 was safe from attackers for a lot of the race, car 4 was busy in attack and defence. Cars 16 and 20 also seemed quite busy?
Looking at the two charts together, car 14 maybe worth having a look at too in terms of 'race interestingness", as do cars 18 and 19, which have quite big spreads in terms of position density?
No comments:
Post a Comment
There seem to be a few issues with posting comments. I think you need to preview your comment before you can submit it... Any problems, send me a message on twitter: @psychemedia