Anyway, here's a couple of quick charts - a race summary chart:
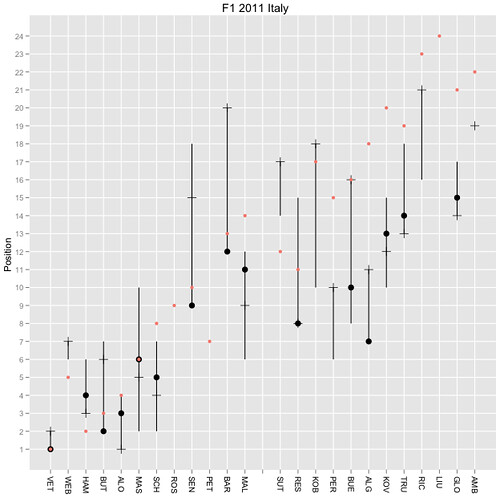
(Red dot: grid position; black dot - final position; plus/horizontal tick mark - position at end of lap 1; vertical line - range of positions held during race.)
I saw the chart before looking at any f the data (I missed the race and all news about it). First impression from race summary chart - what on earth happened on the first lap?
And from the laptimes heat map:
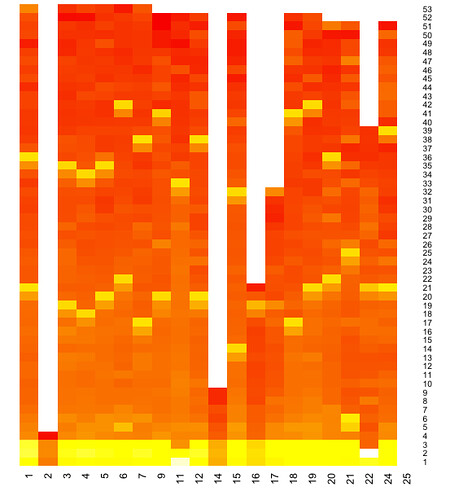
Did the safety car come straight out?!
Note Webber's time in particular raises possible issues with the colouring I use on the heat map; his times were similar to everyone else's but he never got his times down to the times everyone who completed the race did. The chart shows this (sort of); but would it be better if the heat reflected the overall laptime (rather than - as it currently does - the log difference between each driver's lap time and his fastest lap?)
Here's what the heatmap function I use in R comes up with if I just plot the raw laptime:
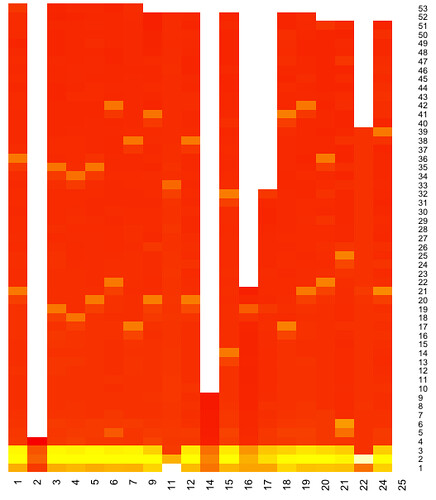
This clearly shows the safety car coming out for the second and third laps. I think I need to get a better feel for how the heat map colouring works, and see if I can come up with better within column, or cross column, colour ranges? (It'd also be nice to be able to overplot purple laps?)
>>what on earth happened on the first lap?<< Only saw the highlights but a Liuzzi going sideways through a corner will do that to your stats. And yes, safety car straight out.
ReplyDeleteThe heatmap is the sort of thing that I initially went, wow, too complex to understand but it is worth having a think about it and a look in detail... and now that I have I really like the information it gives.
ReplyDeleteIntrinsically the idea of using the actual lap times rather than log difference makes most sense but when you compare the two graphs the log version is far more detailed.
I can see exactly where you are coming from with Webbers colours, looks as though he is going so much faster than everyone else but it's just because his hottest lap is red therefore his other 3 laps are orange because they are not much slower than his final lap due to the safety car period.
I love the idea that you can readily see who pitted when, and the safety car period passes the blooming obvious test :-)
I'll admit I'm a bit confused about why car 11 and 22 have white segments early on before continuing to get faster again but other than that it all makes sense.
I think the chart would benefit from a white line for those cars that retired on the first lap (8 and 10) like you've done for d'Ambrosio and I might be inclined to change the heatmap colours to reflect a wider range, could you go from blues through green, yellow and finally red or with it being a log scale, does that limit you to 10 different "bins of colour"?
On balance, since every drivers lap is related to their own fastest lap I think you just have to live with the "odd" colour for drivers like Webber who only do relatively few laps. Just my tuppenceworth for what it's worth.
Love that you are pushing the boundaries in visualisation, great work.
@saltire Thanks for the feedback:-)
ReplyDeleteI used the log because the pit stop times have a difference that's an order of magnitude away from most of the other times... Another approach might be to graduate colours across the rows, eg comparing each car's laptime with the fastest lap by anyone on that lap?
Another alternative might be to colour the squares based on the delta for that driver with his previous lap?
I still haven't got my head round how colour ranging works in R yet... will try to work on that before the next race!
In the meantime, an example of the code I've been using is here: http://f1datajunkie.blogspot.com/2011/09/f1-2011-belgium-lap-time-heat-map.html
There's also an alternative approach using a different R charting library that I haven't had a chance to try yet: http://learnr.wordpress.com/2010/01/26/ggplot2-quick-heatmap-plotting/
If anyone fancies trying out the code, and experimenting with colour settings, please do:-)