Here are the deltas between best lap time and ultimate laptime (so who's not driving to the limit?;-):

The ultimate vs. personal best laptime chart shows similar information in an alternative form - the further away form the line, the further off the ultimate lap:

How does each driver fare by sector?

We can also compare sectors separately:

Or like this....

Deltas again...

If we compare sector rankings with overall classifications, we can get a feel for drivers who are particularly quick - or slow - in a sector; something goes wrong for WEB in sector 3, but GRO is good in 2 and DIR in 3? ALO's losing in sector 1?

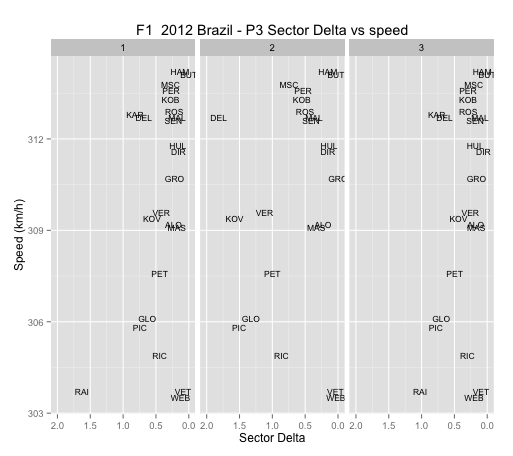
How do deltas compare by sector against sector classification?

How do the deltas compare in each sector (delta from fastes sector time)? Again, lets order by overall classification so we can see folk who are out of sorts:

By the by, how do speeds compare?


No comments:
Post a Comment
There seem to be a few issues with posting comments. I think you need to preview your comment before you can submit it... Any problems, send me a message on twitter: @psychemedia