(Chart reading based on not watching race, hearing any commentary from it, or having read any race reports - it's just a reading of the charts.)
The race history chart shows a battle up front between HAM and VET but then not much action until the battle for the last few points between two cars for 7th and three cars for ninth until the last few laps. The dip around lap 35 or so suggests a safety car?
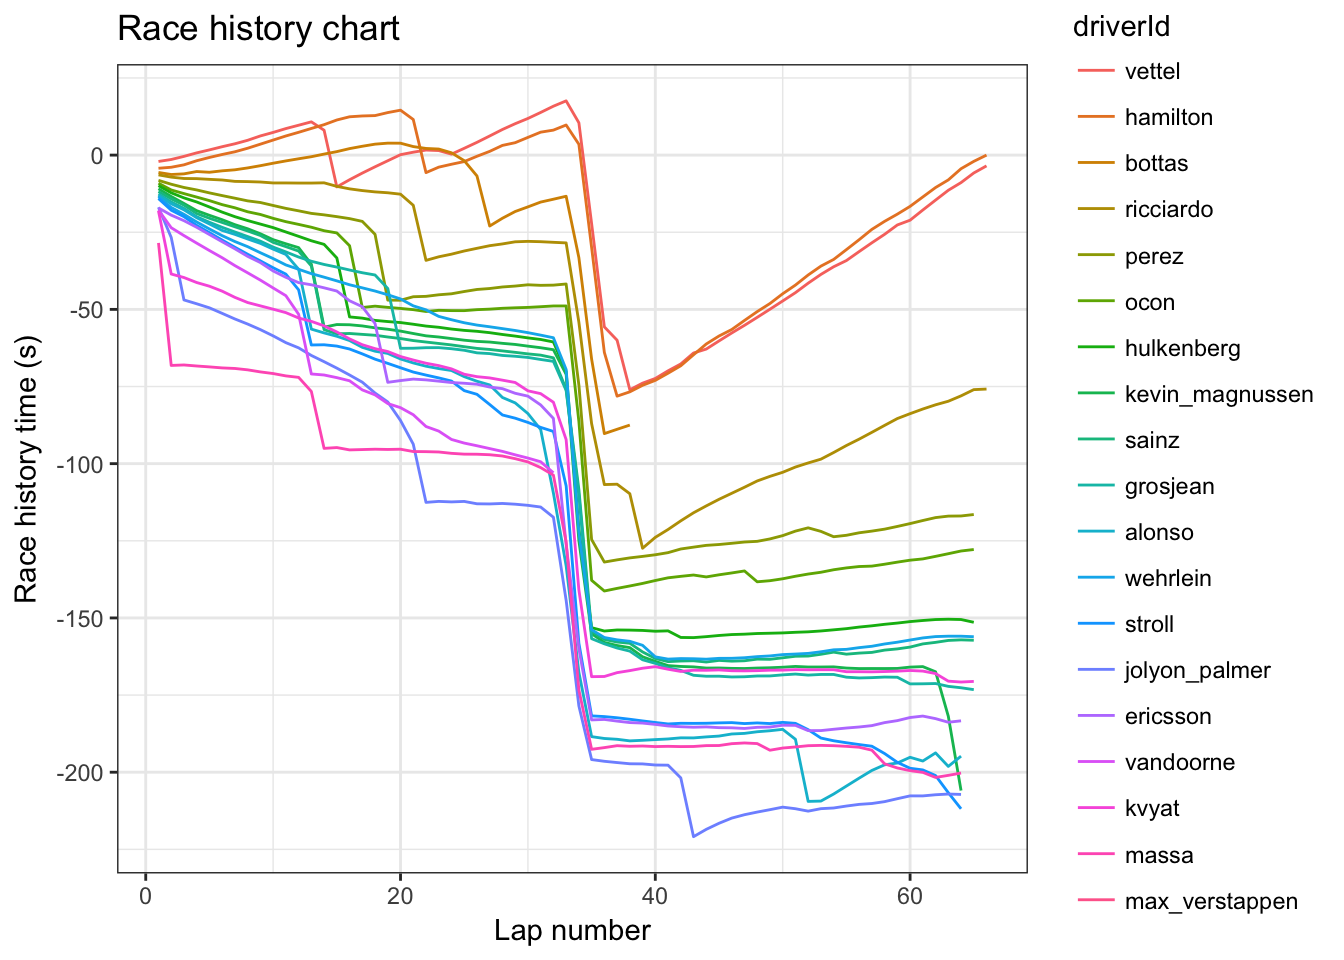
The track history chart shows the paucity of cars finishing the race on the lead lap, with multiple cars two laps behind the leaders.

The battlemap for HAM shows him trailing, but keeping pace with, VET for the first 13 laps, drawing awy from BOT at the same time, taking the lead as VET pitted.

From VET's point of view, we see him leading from HAM at the start, then chasing down BOT at a rate of knots after pitting.

After passing BOT, he had a quick dance with HAM?, he managed to pull away from HAM until the safety car(?). Did HAM make a pass after the safety car(?)? From lap 16 or so we also see the presence of back markers.
The track concordance chart for HAM shows him keeping pace with the car in front (VET) at the start while pulling away from BOT in third at just under a second a lap and the car in fourth by about 20/15 seconds a lap. In the closing laps, we see how the backmarkers appear to have knocked VET back.

The track concordance chart for VET shows his pace in laps 15-20 chasing down BOT and how he lost out to HAM between lapps 45 to 55 or so.

Having a quick look at GRO's race, we see him battling with SAI in the first part of the race, and KVY in the last third as RIC bears down on him like a steam train. (I can almost hear RIC getting shouting with KVY!) Note to self- need to fix the battlemap colours...two factors are 1 and 2 laps behind and need lap(s) ahead/behind colour style cf track concordance chart.)


STR looks to have had an interesting race. Hassled by ERI early on as WEH made a small gap, he then chased down ALO but couldn't get close enough to make a pass. Instead, ERI hunted him down and made the pass. He then chased down ALO for a second time, this time making the pass, and did the same with ERI, who then sat in in his mirrors as KVY pulled away quite a bit further up the road. At lap 42, ERI broke past and charged away.


Correct about the safety car, KMag and Alonso's race being messy. Also about most of the action being the front two.
ReplyDeleteOn Alonso's concordance map you can see how towards the end he unlaps himself from Perez, starts dropping him fast but then has big back-and-forth swings in the last four laps. That was him going for a fastest lap, taking a cooldown lap between attempts. He wasn't that far from getting it either: 1:23.894 compared to the actual FL by Lewis, a 1:23.593.
ReplyDeleteI didn't catch this during the race. Such a shame it didn't work out, could have been a nice consolation prize at his home race.
That's a really nice spot - thanks for pointing it out... One thing I need to do is look for straight line segments relating to individual drivers and then grabbing the gradient so we can see the (constant) rate time gained/lost per lap by comparison.
DeleteIn terms of reading the charts, this adds perceived lines sloping up to the right, and sloping down to the right, as well as patterns to the left (cars ahead) and the right (cars behind) on the chart. So:
- up to the right on the left: gaining on a car ahead;
- up to the right on the right: drawing away from a car behind;
- down to the right on the left: losing ground on a car ahead;
- down to the right on the right: being chased down by a car behind.
Do they have something like this in Nascar
ReplyDeleteHi thanks for sharing thiis
ReplyDelete