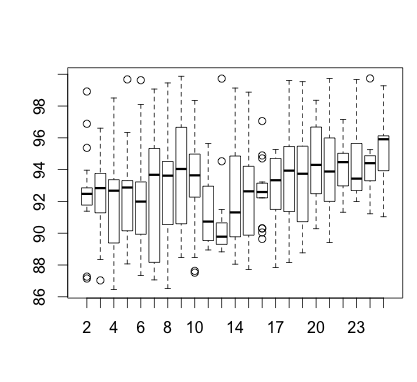
and as a box plot:
A macroscopic view of how each driver and each team utilised free practice 2 using data from the timing sheet provided via the FIA media centre:
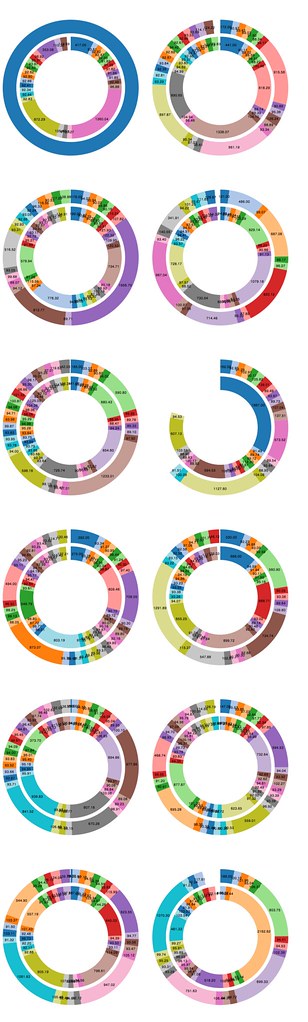
(Originally posted image was incorrect... this is an updated image)
Each pair of rings represents one team. The outer ring is the lower numbered driver. The teams are order from left to right, going down the page (so top left is Red Bull, top right is McLaren).
360 degrees corresponds to the largest elapsed session time measured from F1 timing sheets from across the drivers.
Each segment represents a different time recorded lap on the FIA timing sheet. The angular distance, and hence length of the segment, represents time.
No comments:
Post a Comment
There seem to be a few issues with posting comments. I think you need to preview your comment before you can submit it... Any problems, send me a message on twitter: @psychemedia