Here's the code:
require(RCurl)
require(plyr)
require(ggplot2)
#This is a hack - is there a better way?
nullmin=function(d) {if (is.finite(min(d,na.rm=T))) return(min(d,na.rm=T)) else return(NA)}
gsqAPI = function(key,query,gid=0){ return( read.csv( paste( sep="",'http://spreadsheets.google.com/tq?', 'tqx=out:csv','&tq=', curlEscape(query), '&key=', key, '&gid=', curlEscape(gid) ), na.strings = "null" ) ) }
key='0AmbQbL4Lrd61dEd0S1FqN2tDbTlnX0o4STFkNkc0NGc'
###Calculating how far off ultimate pace each driver is
#Calculate the ultimate laptime
qualiSectors2011=gsqAPI(key,'select *',5)
ultimateQualiLap=ddply(.variables=c("race","driverName"),.data=qualiSectors2011,.fun= function(d) data.frame(d,ultimate=sum(d$sectortime)))
#Calculate fastest qualifying time for each driver
qdata=gsqAPI(key,"select *",4)
minq=ddply(.variables=c("race","team","driverName"),.data=qdata,.fun= function(d) data.frame(minqt=nullmin(min(d$q1time,d$q2time,d$q3time,na.rm=T))))
#Find the fastest overall qualifying time for each race
minq=ddply(.variables=c("race"),.data=minq,.fun= function(d) data.frame(d,qualimin=nullmin(d$minqt)))
qualiData=unique(merge(minq,ultimateQualiLap,by=c("race","driverName")))
#Order the teams
qualiData$team=factor(qualiData$team,levels=c("RBR-Renault","McLaren-Mercedes","Ferrari","Mercedes","Renault","Force India-Mercedes","Sauber-Ferrari","STR-Ferrari","Williams-Cosworth","Lotus-Renault","HRT-Cosworth","Virgin-Cosworth"),ordered=T)
#Order the levels in the race factor in terms of calendar order
qualiData$race=factor(qualiData$race,levels=c("AUSTRALIA","MALAYSIA","CHINA","TURKEY","SPAIN","MONACO","CANADA","EUROPE","GREAT BRITAIN","GERMANY","HUNGARY","BELGIUM","ITALY","SINGAPORE","JAPAN","KOREA","INDIA","ABU DHABI","BRAZIL"),ordered=T)
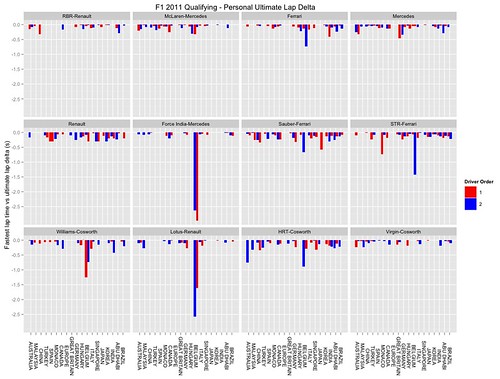
ggplot(subset(qualiData))+geom_bar( stat = "identity",position="dodge",aes(x=race,y=ultimate-minqt,group=driverName,fill=factor(ifelse(driverNum>13,1+(1+driverNum)%%2,1+driverNum%%2))), se=FALSE)+opts(title="F1 2011 Qualifying - Personal Ultimate Lap Delta",axis.text.x=theme_text(angle=-90))+xlab(NULL)+ylab("Fastest lap time vs ultimate lap delta (s)")+scale_fill_manual(name="Driver Order",values = c("red","blue"))+ facet_wrap(~team)
No comments:
Post a Comment
There seem to be a few issues with posting comments. I think you need to preview your comment before you can submit it... Any problems, send me a message on twitter: @psychemedia