Part of the plan is to explore a method for producing simple text based reports based on observations made about various charts of stage split times. So what sorts of chart are in the mix? The following charts are all based on the same stage, but offer different perspectives over it.
The first chart type displays stage split time rank positions. For each driver, record the rank position at each split and at the end of the stage. The drivers are arranged on the horizontal x-axis in order of start position.
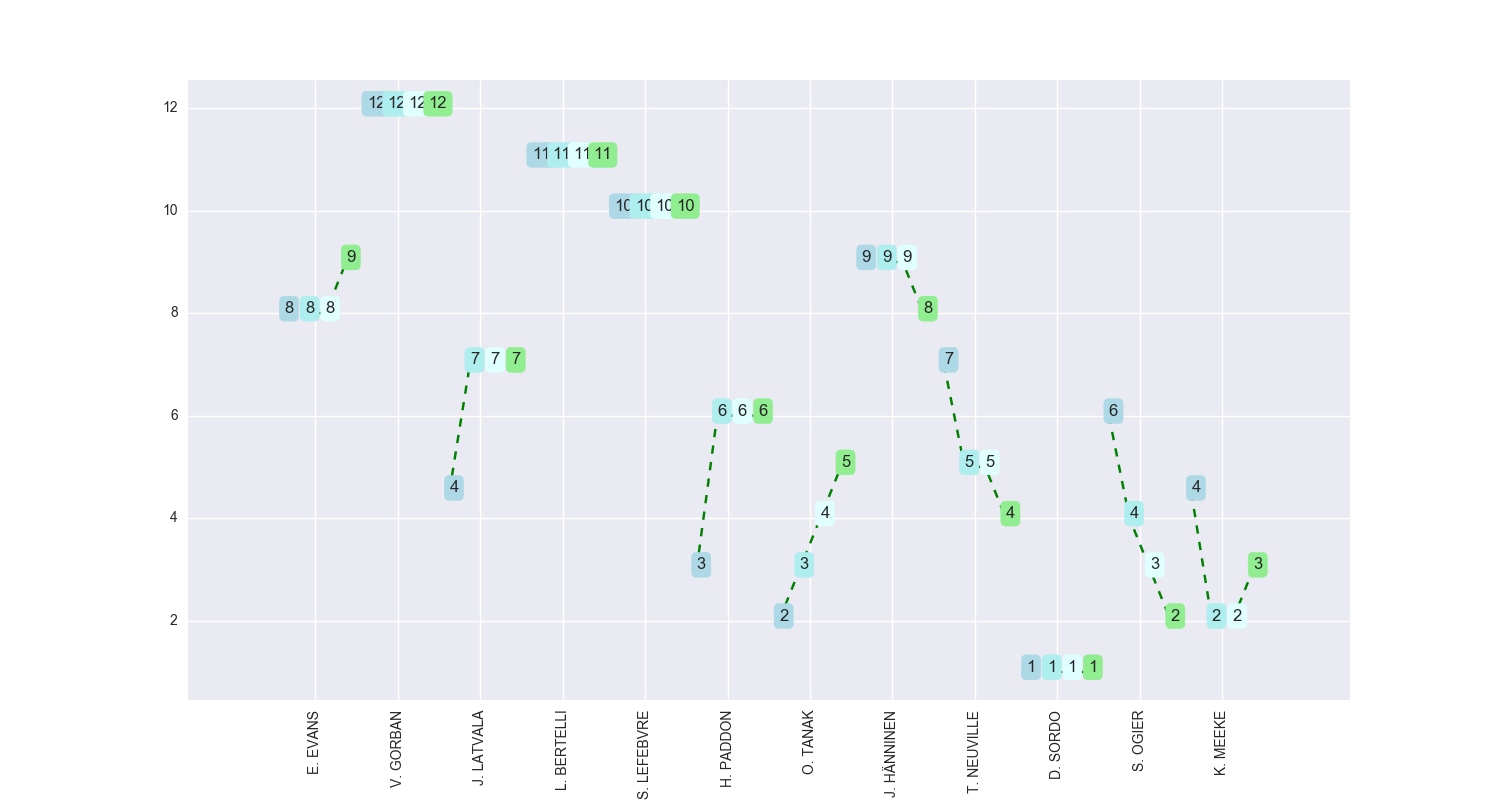
In this first chart, we see how Sordo was ranked first overall at each split point when all drivers' times are considered. (So for example, even though Evans would have ranked first when he passed through each split point, we actually record his ranked positions when the stage is complete and all times are available for ranking purposes.) The line markers represent the position at each split point, with the first split leftmost and the final end-of-stage position rightmost.
Where the lines for each driver are relatively flat, it shows the driver held position across each split. Where the lines trend down left to right it shows the driver improved their rank position across the stage. Where the lines trend up ad the the right, it shows they lost position over the course of the stage.
The second chart type shows the stage split delta time (in seconds) to the first driver on the stage. For each split, calculate the running stage split time relative to the time recorded by the first driver on the stage. (This means that the first driver will have a stage split delta of 0s at each split and at the end of the stage.)
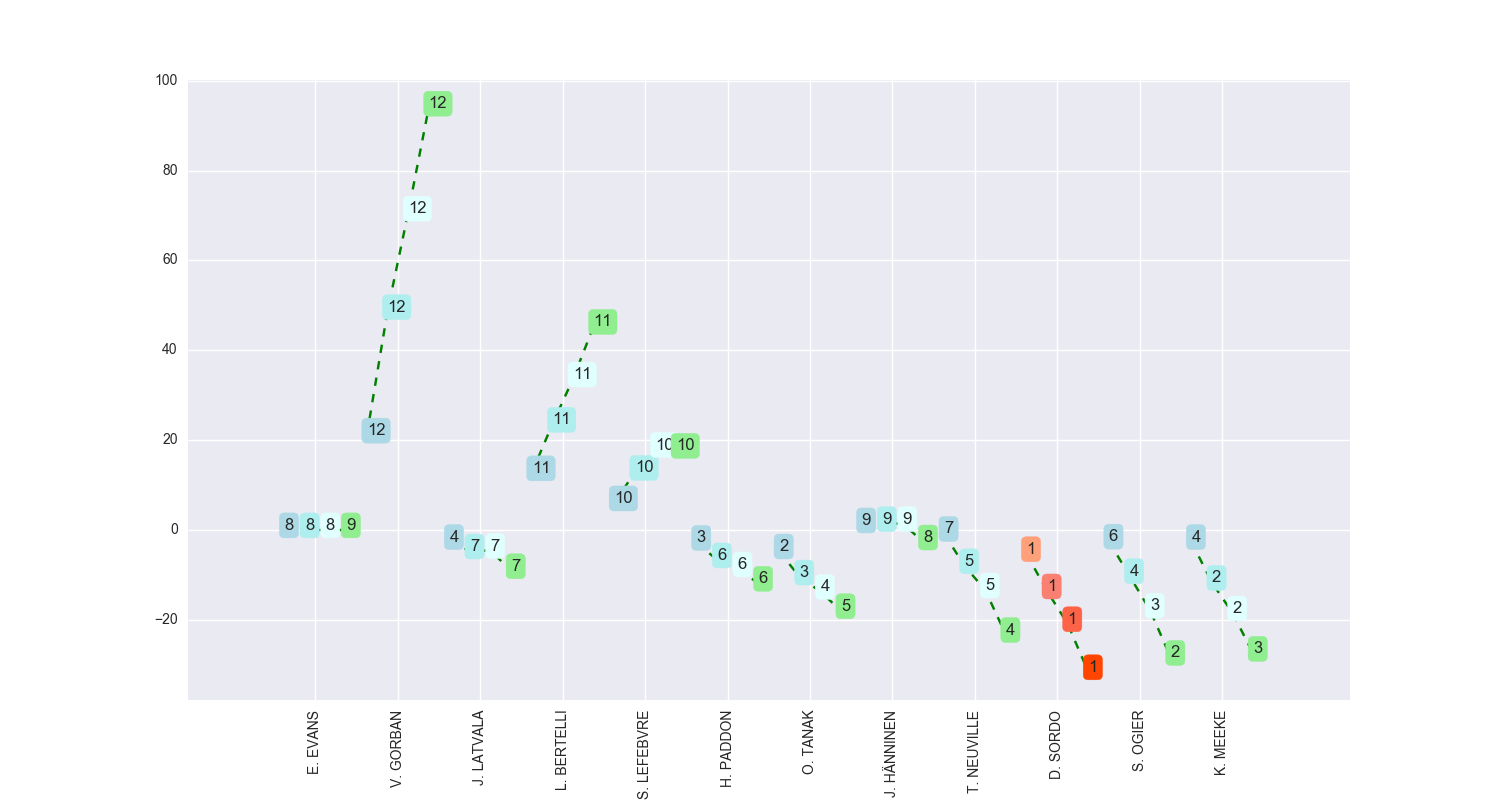
The leader within the stage at each split point is highlighted with the red palette. The labels show the overall rank position at each split.
In this case, horizontal lines show the driver kept pace with the first car (for example, Hanninen), faster with a negative time (vertical y-axis, below the first car, such as Sordo) or slower with a positive time (above the first car, such as Bertelli). Traces moving up and to the right show the driver lost time relative to the first car on the stage. Traces moving down to the right show the driver gained time compared to the first car on stage as they progressed through the stage.
The third chart type shows the stage sector delta time (in seconds) relative to the fastest stage sector time. That is, calculate the "sector time" of each driver (the time between each split point along the stage), find the best (fastest) sector time at each split, and then for each driver find their sector delta from this fastest time.
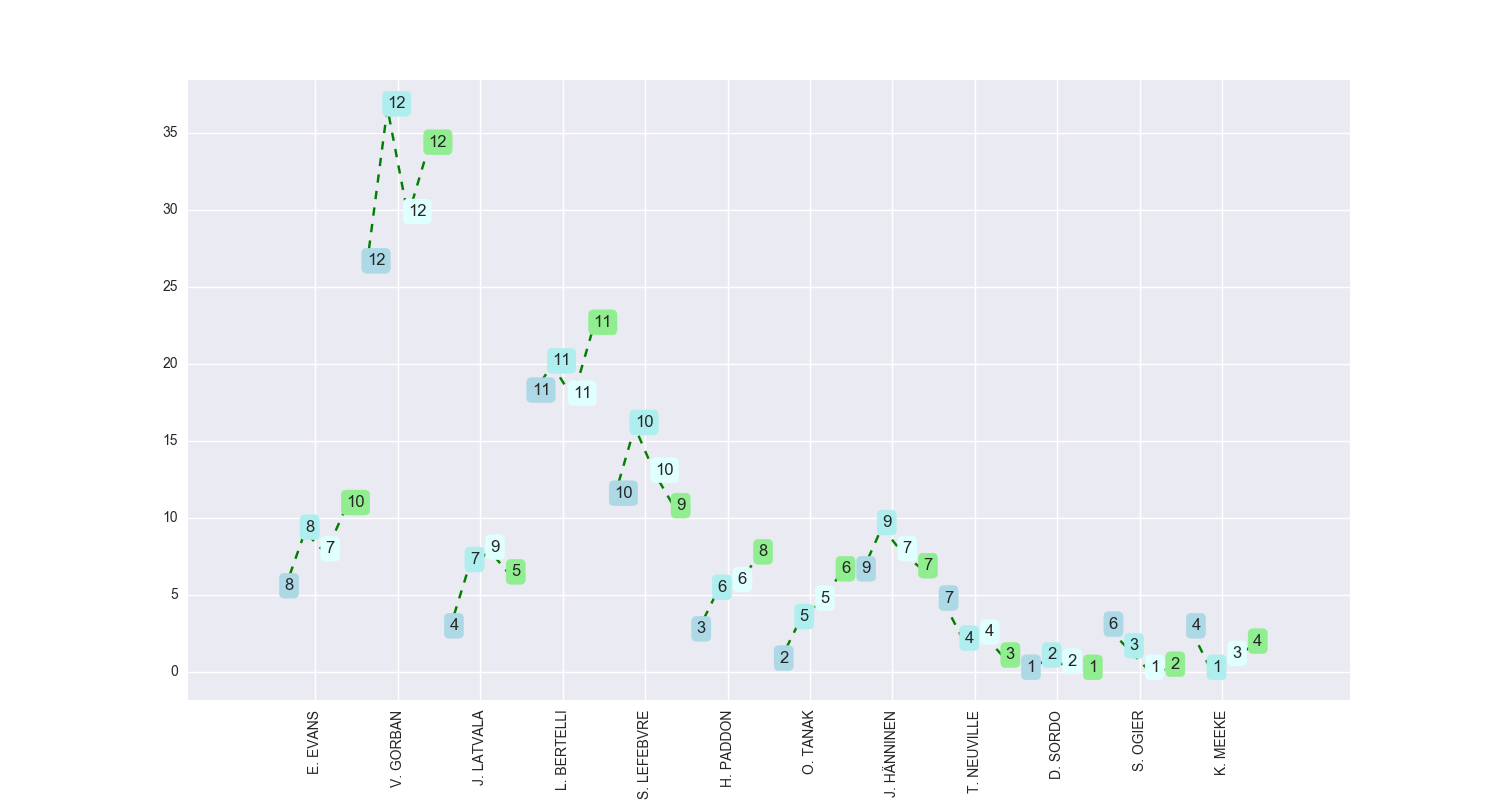
Using this chart, we can get information about how much time each driver gained or lost compared to the driver who got between two split points in the shortest time. The labels show the split sector time rank. In this case, we see that despite being ranked first in terms of overall (accumulated) stage time at each split (the first chart), Sordo does not record the fastest time between splits 1 and 2 (that honour goes to Meeke), or splits 2 and 3 (where Ogier was fastest), although he does record the fastest time going between the start and split 1, and between split 3 and the end of the stage.
The final chart type shows the stage split delta time (in seconds) relative to the overall leader at start of stage. The stage leader is identified as the driver whose split times are all 0s (so Meeke was the rally leader prior to this stage). In the chart below, the driver who was ranked best overall (i.e. in terms of accumulated stage time) at each split is highlighted, although it should be possible instead highlight the driver who was fastest in each sector, or was in the lead of the rally overall prior to the start of the stage.
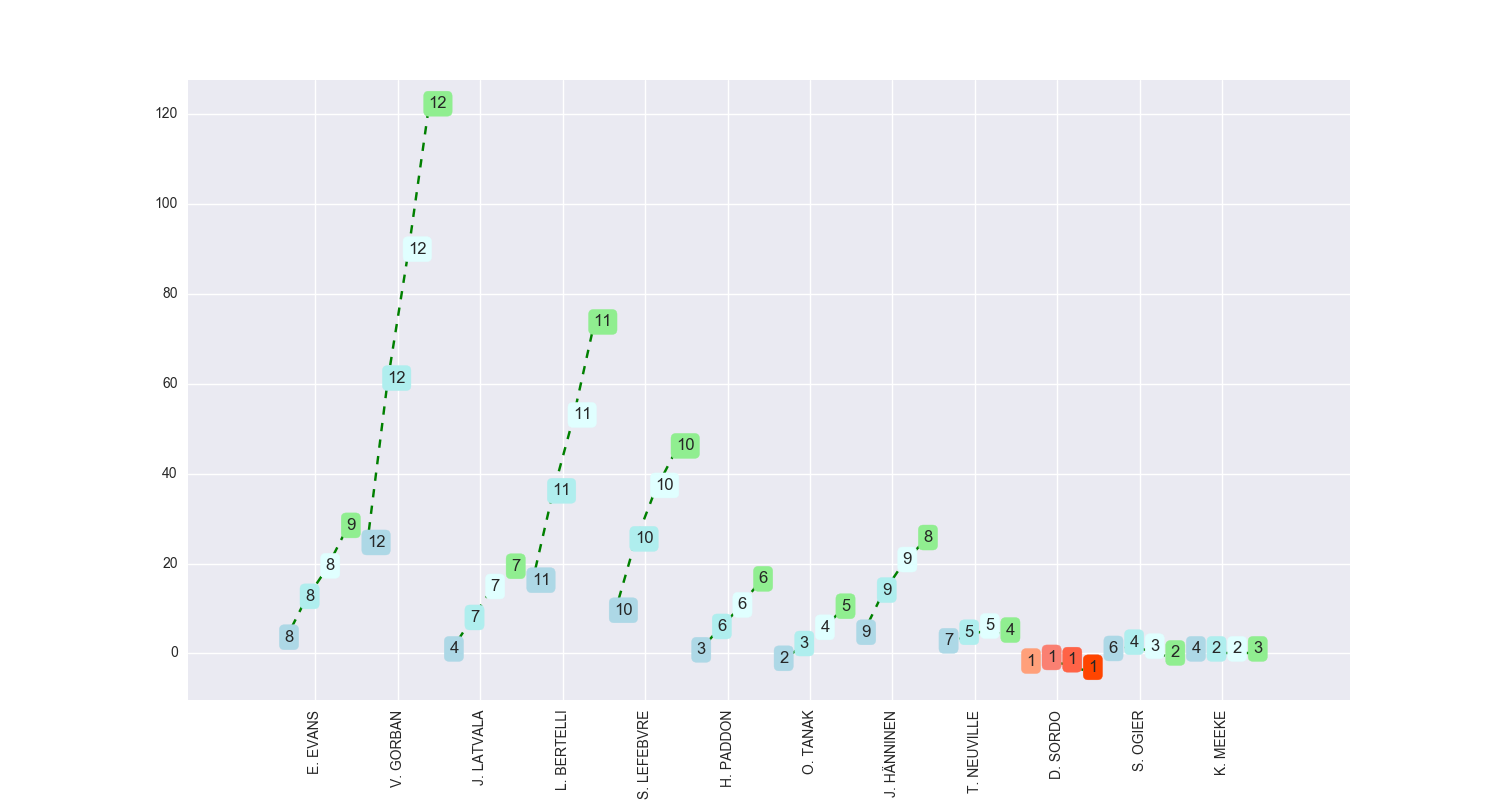
In this case, we see that Sordo made only a slight gain on rally leader Meeke in terms of time, whereas Hanninen lost about 6 seconds to him between each and every split point.
No comments:
Post a Comment
There seem to be a few issues with posting comments. I think you need to preview your comment before you can submit it... Any problems, send me a message on twitter: @psychemedia