From this information, we can find the accumulated stage time of each car - simply add the offset to the corresponding split time of the first car.
Given the accumulated stage time of a car as it passes each timing control, we can also calculate the time the car spent going between those controls: for two consecutive split times, simply subtract the first split-time from the second. In circuit racing, this would be called a sector time (I'm not sure if rallyspeak uses the same terminology?). Adding up all the sector times recorded by a car should give its stage time.
If for each sector we find the minimum sector time, we can subtract this from the each car's sector time to find the sector time "delta" for that car - the time over the fastest time to complete that sector. (An ultimate stagetime is then given as the sum of the minimum sector times for the stage. A driver could then be said to drive an ultimate stage if his sector times are the fastest in each sector for that stage.)
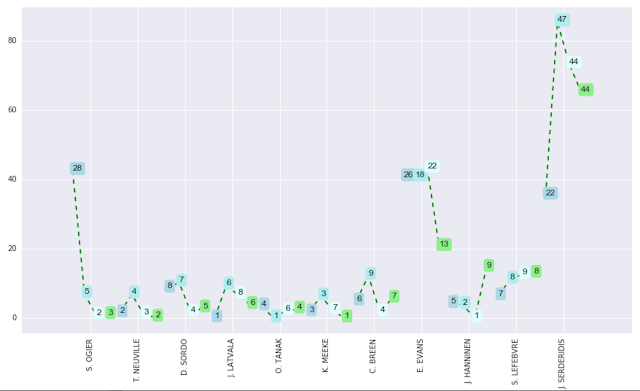
Just as we could chart split time deltas at stage splits (the times reported in the WRC results shown above), as well as rebased deltas relative to an arbitrary driver, we can also chart the deltas to the minimum sector time for each driver.
The following chart from Stage 3 of the 2017 Monte Carlo rally shows how Ogier was 40s behind the minimum sector time for the first sector, lost a few seconds in the second, but was then on the ball in the latter half of the stage. Evans lost 40s or so in each of the first 3 sectors, and dropped 20s in the last sector. Hanninen was competitive for the first three sectors, but lost time somewhere in the last sector.
(The number labels represent the overall rally ranking (rather than the RC1 relative class ranking shown in the charts in the previous post) based on sector time for that sector. A driver driving an ultimate stage would have position 1 for each sector.)
As well as grouping by driver, we can group by sector. Trends within a sector may show how conditions improved or worsened over the course of the runners. The grouping also highlights drivers who lost time in a particular sector - the number labels in this case represent the car number.
Notes on how to generate these charts will be published at some point...


No comments:
Post a Comment
There seem to be a few issues with posting comments. I think you need to preview your comment before you can submit it... Any problems, send me a message on twitter: @psychemedia